The ShapeSheet is the spreadsheet-like
interface that resides behind every Visio shape. It supports functions
similar to Excel, so you can actually program behaviors into shapes
without typing lines of code.
1. Introducing the ShapeSheet
Perhaps you have discovered the mysterious Show
ShapeSheet button on the Developer tab, with its big blue, red, and
gray table icon that beckons clicking whenever a shape is selected.
Click it and the ShapeSheet window appears. This is the key to adding
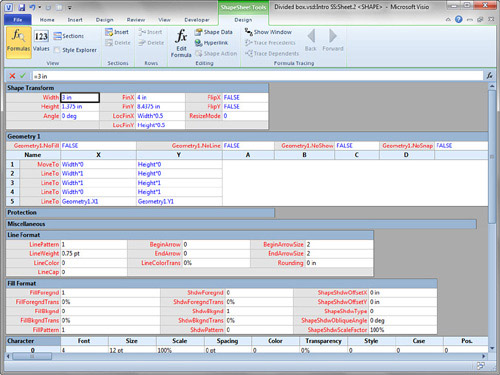
sophistication to your shapes. Figure 1 shows the ShapeSheet for a simple rectangle drawn with the Rectangle tool.

The ShapeSheet is a special-purpose, brightly
colored spreadsheet, similar to Microsoft Excel (circa 1992, but I
digress...). The ShapeSheet reveals the behind-the-scenes definition of
every Visio shape, holding information about its size, position,
geometry, formatting, protection, text block, Shape Data fields, and
more.
Remember that if you are just drawing with Visio and
creating pure graphical symbols, you do not need the ShapeSheet.
However, if you want a shape to be smarter than ordinary clip art, you
need to understand how it works.
Here’s a list of just some of the things you can do via the ShapeSheet:
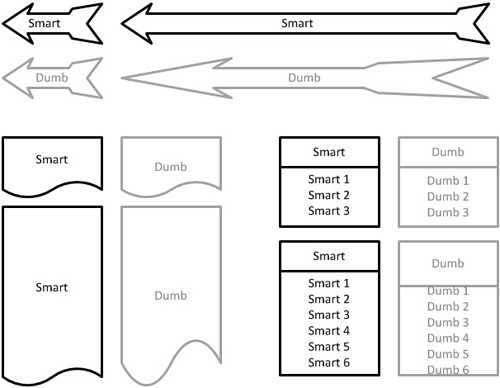
- Create smart geometry that behaves well when shapes stretch. In Figure 2,
you see “smart” and “dumb” versions of three shapes. Notice that the
smart versions don’t uniformly stretch. Instead, parts of these shapes
maintain proportion, which increases visual consistency and leaves more
space for text.

- Add custom Actions to the right-click menu and make geometry, formatting, text, and even code respond to them.
- Create
multishapes that can change form via right-mouse clicks or Shape Data
field values. Imagine a stop-light symbol that can be set to glow red,
yellow, or green at the click of a mouse or an electrical switch symbol
that closes or opens when on or off right-mouse actions are selected.
- Store data and calculations in shapes, hidden from users using User-defined cells instead of Shape Data fields.
- Conditionally change the color or other formatting of a shape based on its size, position, or the value of a Shape Data field.
- Display data and calculation results in a shape’s text.
- Protect a shape’s size, position, formatting, text, and other attributes from being edited.