Excel Worksheet Functions That Calculate Confidence Intervals
The preceding section’s
discussion of the use of the normal distribution made the assumption
that you know the standard deviation in the population. That’s not an
implausible assumption, but it is true that you often don’t know the
population standard deviation and must estimate it on the basis of the
sample you take. There are two different distributions that you need
access to, depending on whether you know the population standard
deviation or are estimating it. If you know it, you make reference to
the normal distribution. If you are estimating it from a sample, you use
the t-distribution.
Excel 2010 has two worksheet functions, CONFIDENCE.NORM() and CONFIDENCE.T(), that help calculate the width
of confidence intervals. You use CONFIDENCE.NORM() when you know the
population standard deviation of the measure . You use CONFIDENCE.T() when you don’t know
the measure’s standard deviation in the population and are estimating it
from the sample data.
Versions of Excel prior to
2010 have the CONFIDENCE() function only. Its arguments and results are
identical to those of the CONFIDENCE.NORM() consistency function. Prior
to 2010 there was no single worksheet function to return a confidence
interval based on the t-distribution. However, as you’ll see in this
section, it’s very easy to replicate CONFIDENCE.T() using either T.INV()
or TINV(). You can replicate CONFIDENCE.NORM() using NORM.S.INV() or
NORMSINV().
Using CONFIDENCE.NORM() and CONFIDENCE()
Figure 3 shows a small data set in cells A2:A17. Its mean is in cell B2 and the population standard deviation in cell C2.
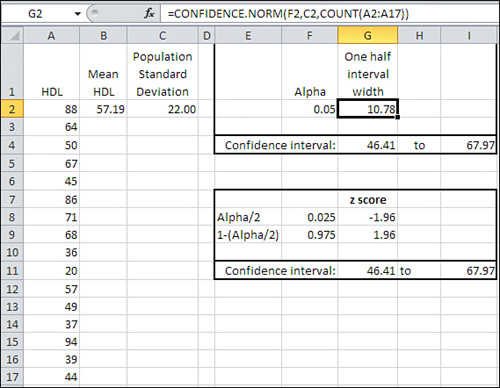
In Figure 3, a value called alpha
is in cell F2. The use of that term is consistent with its use in other
contexts such as hypothesis testing. It is the area under the curve
that is outside the limits of the confidence interval. In Figure 1,
alpha is the sum of the shaded areas in the curve’s tails. Each shaded
area is 2.5% of the total area, so alpha is 5% or 0.05. The result is a
95% confidence interval.
Cell G2 in Figure 3
shows how to use the CONFIDENCE.NORM() function. Note that you could
use the CONFIDENCE() compatibility function in the same way. The syntax
is
=CONFIDENCE.NORM(alpha, standard deviation, size)
where size
refers to sample size. As the function is used in cell G2, it specifies
0.05 for alpha, 22 for the population standard deviation, and 16 for
the count of values in the sample:
=CONFIDENCE.NORM(F2,C2,COUNT(A2:A17))
This returns 10.78 as
the result of the function, given those arguments. Cells G4 and I4 show,
respectively, the upper and lower limits of the 95% confidence
interval.
There are several points to note:
CONFIDENCE.NORM()
is used, not CONFIDENCE.T(). This is because you have knowledge of the
population standard deviation and need not estimate it from the sample
standard deviation. If you had to estimate the population value from the
sample, you would use CONFIDENCE.T(), as described in the next section.
Because
the sum of the confidence level (for example, 95%) and alpha always
equals 100%, Microsoft could have chosen to ask you for the confidence
level instead of alpha. It is standard to refer to confidence intervals
in terms of confidence levels such as 95%, 90%, 99%, and so on.
Microsoft would have demonstrated a greater degree of consideration for
its customers had it chosen to use the confidence level instead of alpha
as the function’s first argument.
The
Help documentation states that CONFIDENCE.NORM(), as well as the other
two confidence interval functions, returns the confidence interval. It
does not. The value returned is one half of the confidence interval. To
establish the full confidence interval, you must subtract the result of
the function from the mean and add the result to the mean.
Still in Figure 3,
the range E7:I11 constructs a confidence interval identical to the one
in E1:I4. It’s useful because it shows what’s going on behind the scenes
in the CONFIDENCE.NORM() function. The following calculations are
needed:
Cell F8 contains the
formula =F2/2. The portion under the curve that’s represented by
alpha—here. 0.05, or 5%—must be split in half between the two tails of
the distribution. The leftmost 2.5% of the area will be placed in the
left tail, to the left of the lower limit of the confidence interval.
Cell
F9 contains the remaining area under the curve after half of alpha has
been removed. That is the leftmost 97.5% of the area, which is found to
the left of the upper limit of the confidence interval.
Cell
G8 contains the formula =NORM.S.INV(F8). It returns the z-score that
cuts off (here) the leftmost 2.5% of the area under the unit normal
curve.
Cell G9
contains the formula =NORM.S.INV(F9). It returns the z-score that cuts
off (here) the leftmost 97.5% of the area under the unit normal curve.
Now we have in cell G8
and G9 the z-scores—the standard deviations in the unit normal
distribution—that border the leftmost 2.5% and rightmost 2.5% of the
distribution. To get those z-scores into the unit of measurement we’re
using—a measure of the amount of HDL in the blood—it’s necessary to
multiply the z-scores by the standard error of the mean, and add and
subtract that from the sample mean. This formula does the addition part
in cell G11:
=B2+(G8*C2/SQRT(COUNT(A2:A17)))
Working from the inside out, the formula does the following:
1. | Divides
the standard deviation in cell C2 by the square root of the number of
observations in the sample. As noted earlier, this division returns the
standard error of the mean.
|
2. | Multiplies
the standard error of the mean by the number of standard errors below
the mean (−1.96) that bounds the lower 2.5% of the area under the curve.
That value is in cell G8.
|
3. | Adds the mean of the sample, found in cell B2.
|
Steps 1 through 3 return the
value 46.41. Note that it is identical to the lower limit returned using
CONFIDENCE.NORM() in cell G4.
Similar steps are used to get
the value in cell I11. The difference is that instead of adding a
negative number (rendered negative by the negative z-score −1.96), the
formula adds a positive number (the z-score 1.96 multiplied by the
standard error returns a positive result). Note that the value in I11 is
identical to the value in I4, which depends on CONFIDENCE.NORM()
instead of on NORM.S.INV().
Notice that CONFIDENCE.NORM() asks you to supply three arguments:
Alpha, or 1 minus the confidence level— Excel can’t predict with what level of confidence you want to use the interval, so you have to supply it.
Standard deviation—
Because CONFIDENCE.NORM() uses the normal distribution as a reference
to obtain the z-scores associated with different areas, it is assumed
that the population standard deviation is in use. Excel doesn’t have access to the full
population and thus can’t calculate its standard deviation. Therefore,
it relies on the user to supply that figure.
Size, or, more meaningfully, sample size— You aren’t directing Excel’s attention to the sample itself (cells A2:A17 in Figure 3),
so Excel can’t count the number of observations. You have to supply
that number so that Excel can calculate the standard error of the mean.
You should use
CONFIDENCE.NORM() or CONFIDENCE() if you feel comfortable with them and
have no particular desire to grind it out using NORM.S.INV() and the
standard error of the mean. Just remember that CONFIDENCE.NORM() and
CONFIDENCE() do not return the width of the entire interval, just the
width of the upper half, which is identical in a symmetric distribution
to the width of the lower half.