Using CONFIDENCE.T()
Figure 4 makes two basic changes to the information in Figure 3:
It uses the sample standard deviation in cell C2 and it uses the
CONFIDENCE.T() function in cell G2. These two basic changes alter the
size of the resulting confidence interval.
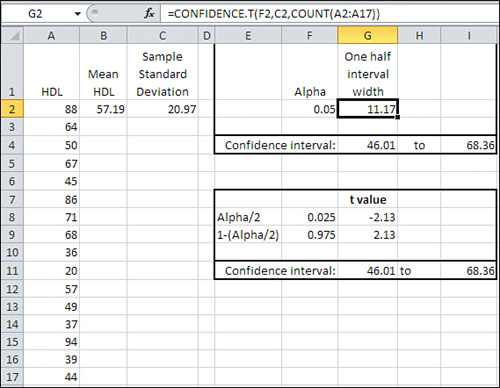
Notice first that the 95% confidence interval in Figure 4 runs from 46.01 to 68.36, whereas in Figure 7.8 it runs from 46.41 to 67.97. The confidence interval in Figure 7.8 is narrower. There, you can see that there’s more area under the tails of the
leptokurtic distribution than under the tails of the normal
distribution. You have to go out farther from the mean of a leptokurtic
distribution to capture, say, 95% of its area between its tails.
Therefore, the limits of the interval are farther from the mean and the
confidence interval is wider.
Because you use the
t-distribution when you don’t know the population standard deviation,
using CONFIDENCE.T() instead of CONFIDENCE.NORM() brings about a wider
confidence interval.
The shift from the normal distribution to the t-distribution also appears in the formulas in cells G8 and G9 of Figure 4, which are:
=T.INV(F8,COUNT(A2:A17)-1)
and
=T.INV(F9,COUNT(A2:A17)-1)
Note that these cells use T.INV() instead of NORM.S.INV(), as is done in Figure 3.
In addition to the probabilities in cells F8 and F9, T.INV() needs to
know the degrees of freedom associated with the sample standard
deviation.
Using the Data Analysis Add-in for Confidence Intervals
Excel’s Data Analysis
add-in has a Descriptive Statistics tool that can be helpful when you
have one or more variables to analyze. The Descriptive Statistics tool
returns valuable information about a range of data, including measures
of central tendency and variability, skewness and kurtosis. The tool
also returns half the size of a confidence interval, just as
CONFIDENCE.T() does.
Note
The Descriptive Statistics
tool’s confidence interval is very sensibly based on the t-distribution.
You must supply a range of actual data for Excel to calculate the other
descriptive statistics, and so Excel can easily determine the sample
size and standard deviation to use in finding the standard error of the
mean. Because Excel calculates the standard deviation based on the range
of values you supply, the assumption is that the data constitutes a
sample, and therefore a confidence interval based on t instead of z is
appropriate.
To use the Descriptive Statistics tool, you must first have installed the Data Analysis add-in. Once this
add-in is installed from the Office disc and made available to Excel,
you’ll find it in the Analysis group on the Ribbon’s Data tab.
Once the add-in is
installed and available, click Data Analysis in the Data tab’s Analysis
group, and choose Descriptive Statistics from the Data Analysis list
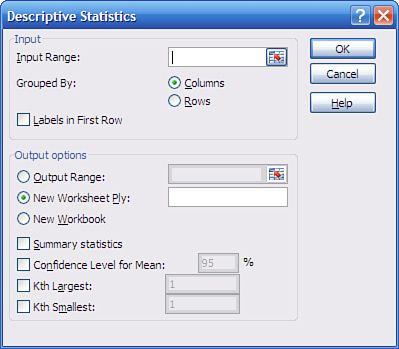
box. Click OK to get the Descriptive Statistics dialog box shown in Figure 5.
Note
To handle several variables at
once, arrange them in a list or table structure, enter the entire range
address in the Input Range box, and click Grouped by Columns.
To get descriptive statistics
such as the mean, skewness, count, and so on, be sure to fill the
Summary Statistics check box. To get the confidence interval, fill the
Confidence Level for Mean check box and enter a confidence level such as
90, 95, or 99 in the associated edit box.
If your data has a header cell
and you have included it in the Input Range edit box, fill the Labels
check box; this informs Excel to use that value as a label in the output
and not to try to use it as an input value.
When you click OK, you get output that resembles the report shown in Figure 6.
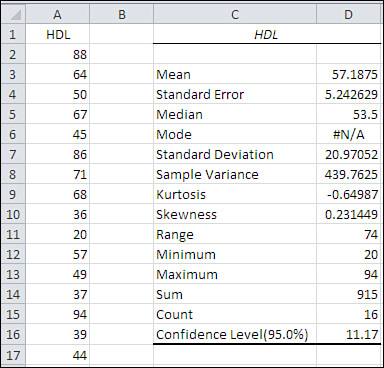
Notice that the value in cell D16 is the same as the value in cell G2 of Figure 4. The value 11.17 is what you add and subtract from the sample mean to get the full confidence interval.
The output label for the confidence interval is mildly misleading. Using standard terminology, the confidence level
is not the value you use to get the full confidence interval (here,
11.17); rather, it is the probability (or, equivalently, the area under
the curve) that you choose as a measure of the precision of your
estimate and the likelihood that the confidence interval is one that
captures the population mean. In Figure 6, the confidence level is 95%.
Confidence Intervals and Hypothesis Testing
Both conceptually and
mathematically, confidence intervals are closely related to hypothesis
testing. You often test a
hypothesis about a sample mean and some theoretical number, or about the
difference between the means of two different samples. In cases like
those you might use the normal distribution or the closely related
t-distribution to make a statement such as, “The null hypothesis is
rejected; the probability that the two means come from the same
distribution is less than 0.05.”
That statement is in effect
the same as saying, “The mean of the second sample is outside a 95%
confidence interval constructed around the mean of the first sample.”