Suppose someone told you that you stand 19
units tall. What do you conclude from that information? Does that mean
you’re tall? short? of average height? What percent of the population
is taller than you are?
You don’t know, and you can’t know, because you
don’t know how long a “unit” is. If a unit is four inches long, then
you stand 76 inches, or 6′4″ (rather tall). If a unit is three inches
long, then you stand 57 inches, or 4′9″ (rather short).
The problem is that there’s nothing standard about the word unit.
(In fact, that’s one of the reasons it’s such a useful word.) Now
suppose further that the mean height of all humans is 20 units. If
you’re 19 units tall, you know that you’re shorter than average.
But how much shorter is one unit shorter? If, say,
3% of the population stands between 19 and 20 units, then you’re only a
little shorter than average. Only 3% of the population stands between
you and the average height.
If, instead, 34% of the population were between 19
and 20 units tall, then you’d be fairly short: Everyone who’s taller
than the mean of 20, plus another 34% between 19 and 20 units, would be
taller than you.
Suppose now that you know
the mean height in the population is 20 units, and that 3% of the
population is between 19 and 20 units tall. With that knowledge, with
the context provided by knowing the mean height and the variability of
height, “unit” becomes a standard. Now when someone tells you that
you’re 19 units tall, you can apply your knowledge of the way that
standard behaves, and immediately conclude that you’re a skosh shorter
than average.
Arranging for a Standard
A standard deviation acts much like the fictitious unit described in the prior section. In any frequency distribution that follows a normal curve, these statements are true:
You find about 34% of the records between the mean and one standard deviation from the mean.
You find about 14% of the records between one and two standard deviations from the mean.
You find about 2% of the records between two and three standard deviations from the mean.
These standards are displayed in Figure 1.
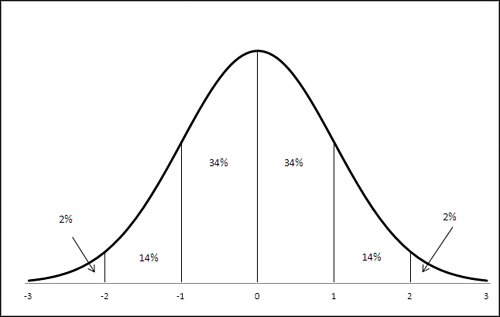
The numbers shown on the horizontal axis in Figure are called z-scores.
A z-score, or sometimes z-value, tells you how many standard deviations
above or below the mean a record is. If someone tells you that your
height in z-score units is +1.0, it’s the same as saying that your
height is one standard deviation above the mean height.
Similarly, if your weight in z-scores is −2.0, your weight is two standard deviations below the mean weight.
Because of the way that z-scores slice up the
frequency distribution, you know that a z-score of +1.0 means that 84%
of the records lie below it: Your height of 1.0 z means that you are as
tall as or taller than 84% of the other observations. That 84%
comprises the 50% below the mean, plus the 34% between the mean and one
standard deviation above the mean. Your weight, −2.0 z, means that you
outweigh only 2% of the other observations. Hence the term standard deviation. It’s standard
because it doesn’t matter whether you’re talking about height, weight,
IQ, or the diameter of machined piston rings. If it’s a variable that’s
normally distributed, then one standard deviation above the mean is
equal to or greater than 84% of the other observations. Two standard
deviations below the mean is equal to or less than 98% of the other
observations.
It’s a deviation
because it expresses a distance from the mean: a departure from the
mean value. More on that shortly, in
“Dividing by N − 1,” but first it’s helpful to bring in a little more
background.
Thinking in Terms of Standard Deviations
With some important exceptions, you are likely to
find yourself thinking more about standard deviations than about other
measures of variability. The standard deviation is in
the same unit of measurement as the variable you’re interested in. If
you’re studying the distribution of miles per gallon of gasoline in a
sample of cars, you might find that the standard deviation is four
miles per gallon. The mean mileage of car brand A might be four mpg, or
one standard deviation, greater than brand B’s mean mileage.
That’s very convenient and it’s one reason that
standard deviations are so useful. It’s helpful to be able to think to
yourself, “The mean height is 69 inches. The standard deviation is 3
inches.” The two statistics are in the same metric.
For example, it’s easy to get comfortable with
statements such as “the mean was 20 miles per gallon and the standard
deviation was 5 miles per gallon.” It’s a lot harder to feel
comfortable with “the mean was 20 miles per gallon and the variance was
25 squared miles per gallon.” What does a “squared mile per gallon”
even mean?
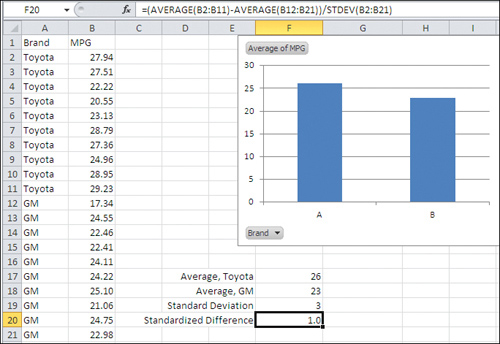
Fortunately, standard deviations are more
intuitively informative. Suppose you have the mpg of ten Toyota cars in
B2:B11, and the mpg of ten GM cars in B12:B21. One way to express the
difference between the two brands’ mean gas mileage is this:
=(AVERAGE(B2:B11) − AVERAGE(B12:B21)) / STDEV(B2:B21)
That Excel formula gets the difference in the mean
values for the two brands, and divides by the standard deviation of the
mpg for all 20 cars. It’s shown in Figure 2.
In Figure 3,
the difference between the two brands in standard deviation units is
1.0. As you become more familiar and comfortable with standard
deviations, you will find yourself automatically thinking things such
as, “One standard deviation—that’s quite a bit.” Expressed in this way,
you don’t need to know whether 26 mpg vs. 23 mpg is a large difference
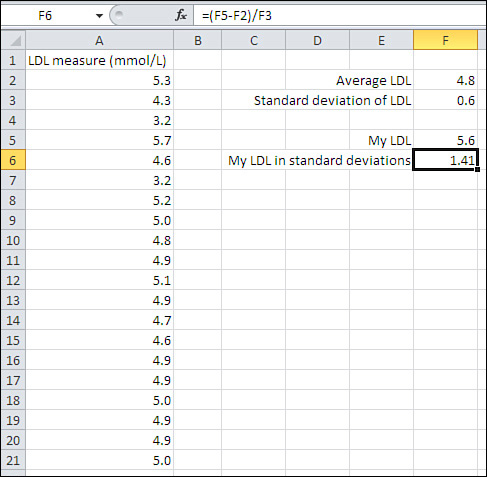
or a small one. Nor do you need to know whether 5.6 mmol/L (millimoles
per liter) of LDL cholesterol is high, low, or typical.
All you need to know is that 5.6 is more than one standard deviation
above the mean of 4.8 to conclude that it indicates moderate risk of
diseases associated with the thickening of arterial walls.
The
point is that when you’re thinking in terms of standard deviation units
in an approximately normal distribution, you automatically know where a
z-score is in the overall distribution. You know how far it is from
another z-score. You know whether the difference between two means,
expressed as z-scores, is large or small.
First, though, you have to calculate the
standard deviation. Excel makes that very easy. There was a time when
college students sat side by side at desks in laboratory basements,
cranking out sums of squares on Burroughs adding machines with hand
cranks. Now all that’s needed is to enter something like =STDEV(A2:A21).