This section covers how to report and
analyze information in a master plan. This includes looking at resource
utilization across multiple projects.
1. Sharing Resources Across Projects
You can set up a resource pool for
sharing across projects. To do so, you create a separate file that
contains only the resources used for assignments across multiple
projects. This file typically doesn't contain any tasks or
milestones—just resources in the resource sheet.
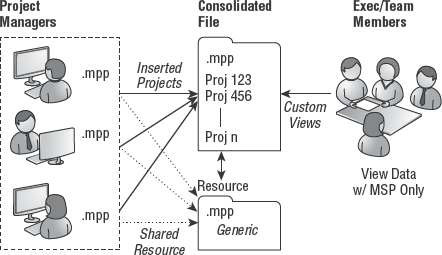
As shown in Figure 1, you can save the shared resources in a separate .mpp file and name it something like Resource Pool.mpp.
Usually, I add the name of the organization, department, or group at
the beginning of the name. This illustrates that the master file is a
separate .mpp file that stakeholders can access or use to generate cross-project reports.
NOTE
If you're going to create a master file and a
shared resource file, it's important to have one dedicated person
responsible for owning and maintaining these files.
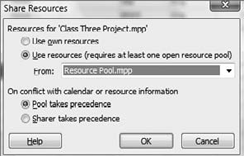
Each project manager who creates a new project file points to the resource pool, as shown in Figure 2, by following these steps:
Select Resource tab => Assignments group => Resource Pool drop-down list => Share Resources.
In the Share Resources dialog box, under Resources For, select Use Resources.
In the From drop-down list, select the Resource Pool file (it must be open for this option to be available).
MPP files don't have multiuser access. This means
only one person at a time can open each file as read/write. Whoever
opens the master file may inadvertently open the source files by
clicking the details of that project, which is why it's wise to insert
projects as read-only—doing so keeps this from happening. If the project
manager who owns the file tries to open it when the master file is
open, they will only be able to open it as read only and essentially
will be locked out from making changes.
The resource-pool file behaves differently. When you
open a file that shares resources, you're given the option to open the
resource pool to see how the resource are being shared .
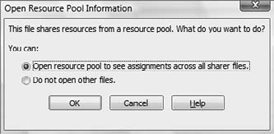
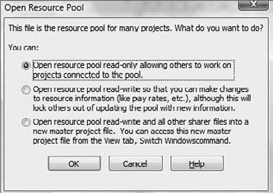
This option lets you view resource assignments across multiple projects. Also, as shown in Figure 4,
when you open the resource pool file, you have three options: to open
it as read-only, so others can continue to use it; to open it as
read/write, so you can make changes but prevent others from using it; or
to open the pool and all sharer files in a new master automatically.
2. Analyzing Resources Across Projects
After you make assignments from a shared resource pool across projects, you can analyze how each resource is being used. In Figure 5,
you can see that Engineer and David Blair are over-allocated on
assignments across multiple projects. In this example, I clicked the
Resource Usage view from the resource pool file . You can
access the same information from any of the source files, depending on
how you open the resource pool.
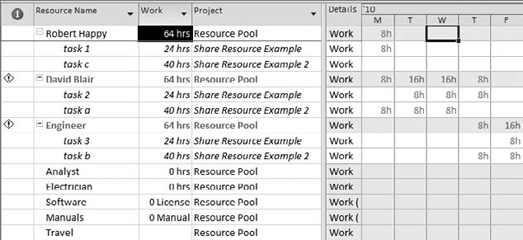
In this view, I added the Project column to help
distinguish where tasks came from. David and the engineer are being used
across two projects, resulting in over-allocations for both resources.
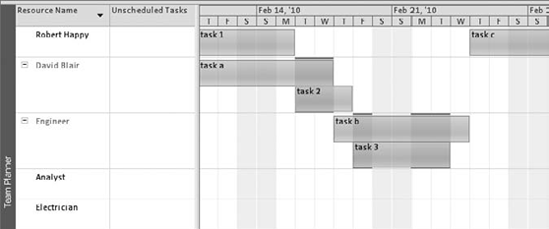
You aren't limited to the Resource Usage view; you can access all the
other resource views, if needed, and make changes to the assignments.
For example, Figure 6 applies the Team Planner view: you can analyze over-allocations and click and drag to change assignments.
3. Roll-Up Reports
Having all your projects loaded in one master file
lets you create more effective roll-up type reports (one pagers).
Rolling up everything into one nice neat report can be very handy when
you're communicating with stakeholders, particularly senior management.
With a master file, Project's powerful communication
and reporting tools are still available. For example, you can use
filtering to display milestones across projects, display only line items
that need to be finished next week, or show only critical paths across
the entire program. In the previous section, you learned how to view
resources across multiple projects. Figure 7 shows an example of viewing milestones across multiple projects.
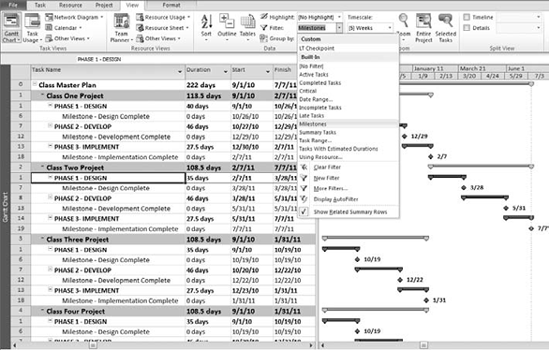
As shown in the figure, you can access the Filter tool in the View tab's Data group . You can use built-in or custom
filters to zero in on a specific set of line items across projects, to
create dashboard-type rolled-up views. Note that for filters to work
across projects, they must be fully expanded. If you run a filter while
certain projects are collapsed, then the filter doesn't apply to that
section.
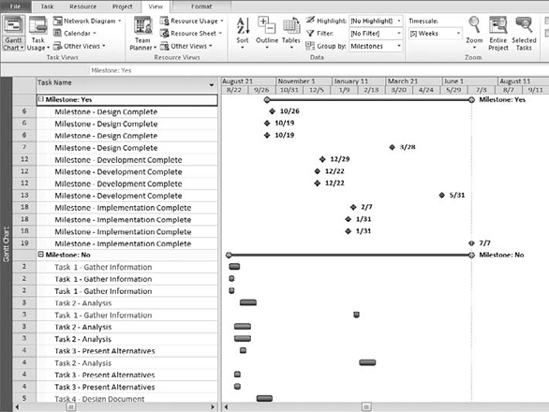
You can also apply other tools, such as grouping. You can access groups under via the View tab's Data group, much like the filtering tool. As shown in Figure 8, you can create a high-level overview of milestones across all projects.
All these filters and groups can apply to not only task views but also resource views. For example, in Figure 9
I clicked the Resource Usage view and applied the Resource group to
roll up by department how many hours, dollars, and units are needed, by
quarter.
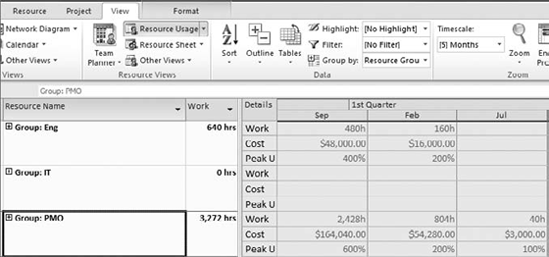
I added Peak Units and Cost to the
time-phased portion of the view and changed the timescale to show months
and quarters. Doing so lets you determine how many resources you need
from each department across all the projects being shared. If you need a
refresher on how to apply groups and filters.