This section explains how to use built-in groups and
create custom groups. Groups can be applied on both task and resource
views. They provide an effective way to communicate and analyze project
information.
1. Built-in Groups
As with filters, Project
comes with many built-in groups that you can use right out of the box.
Grouping is similar to filtering in that it uses the same types of
criteria and conditions, but instead of eliminating tasks that don't
meet the conditions, like filtering does, it reorganizes the tasks based
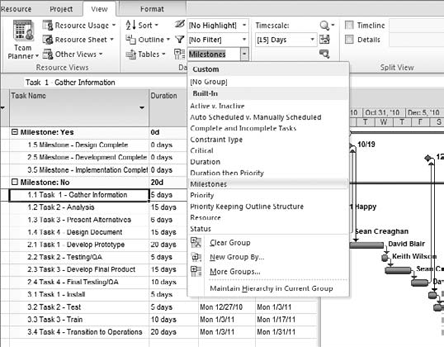
on the conditions. For example, in Figure 1,
grouping by milestone instead of filtering by milestone leaves the
non-milestone line items in view; it just reorganizes the line items
based on the grouping criteria.
To run a group, follow these steps:
Go to View tab => Data group, and click the [No Group] drop-down list.
From the list, select Milestones.
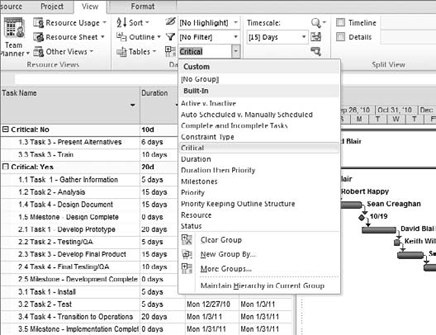
I often group by Critical
to help focus on critical tasks more effectively when I need to bring my
end date in to the left. This is useful when you're meeting with
project team members to crash or fast-track your schedule. To run the
Critical group, as shown in Figure 12.12, follow these steps:
Go to View tab => Data group, and click the [No Group] drop-down list.
From the list, select Critical.
Clients often need to
manage resource workloads more effectively, and grouping can play a
significant role. You can run groups in either task views or resource
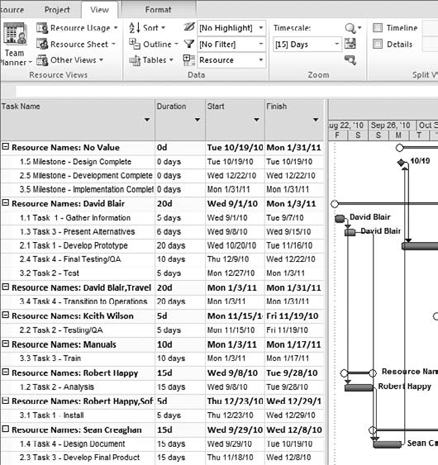
views. The scenario in Figure 3
uses the Gantt chart, which is a task view, to group by resource; this
shows how tasks are distributed among your project team. To apply the
Resource group, follow these steps:
Go to View tab => Data group, and click the [No Group] drop-down list.
From the list, select Resource.
Groups can also be applied in resource views. You can use the Group field in the Resource Sheet view, as shown in Figure 4.
This example gives each resource a group that reflects which department
they work in. To add departments for each resource in the Resource
Sheet view, follow these steps:
Go to View tab => Resource Views group, and click Resource Sheet.
In the Group column, add the appropriate department name for each resource in your resource pool.
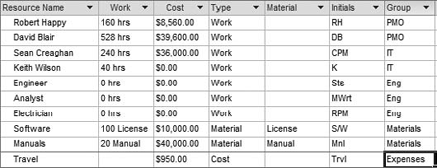
For example, David Blair belongs
to the PMO group and Sean Creaghan belongs to the IT group. You can now
group by department to communicate and report hours and cost at the
department level. As shown in Figure 5, you can create this type of group by following these steps:
In the Resource Sheet view, go to View tab => Data group, and click the [No Group] drop-down list.
From the list, select Resource Group.
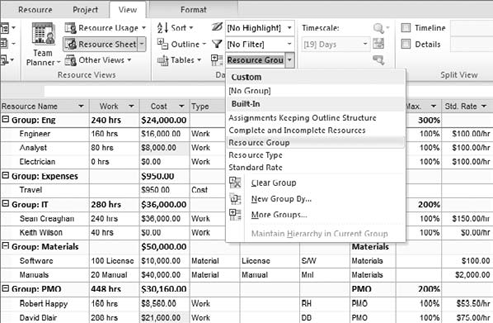
I've added two columns to the resource sheet to display work and cost . This allows you to see both the total hours and total costs for each department.
You can apply the same group
in the Resource Usage view for even more in-depth analysis of where
hours and costs are going over time (see Figure 6). To do this, follow these steps:
Go to View tab => Resource Views group, and click Resource Usage.
Go to View tab => Data group, and click the [No Group] drop-down list.
From the list, select Resource Group.
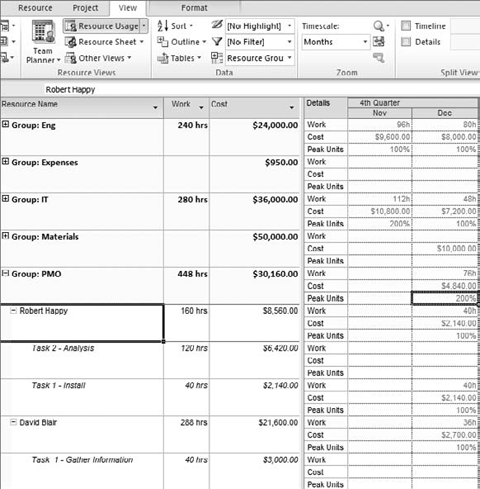
I've added the Cost column at right and also added costs and peak units in the time-phased portion of the view . You can change the timescale using the zoom commands
on the View tab or the zoom slider at lower-right in the window. In
this example, the timescale is set at quarters and months, which lets
you see how each department is spending hours and costs by quarter and
by month. Adding the peak units under Details also allows you to analyze
how many people you need during each time period. For example, 200
percent indicates that two resources are required during the peak work
for that time period.