Troubleshooting issues with a DexSQL log,
we looked at creating a DexSQL log file for use in troubleshooting.
That recipe didn't require any special software, but it did take a lot
of back and forth to limit the contents of the file to the specific
process to be logged. The free Support Debugging Tool from Microsoft not
only makes this much easier, but it also adds a host of features and
logging options to get more information for support.
How to do it...
To create a DexSQL log:
1. In Microsoft Dynamics GP select Tools | Support Debugging Tool from the Microsoft Dynamics GP menu.
2. In the center of the screen in the SQL Logging section, click on Turn On:

3. Select Financial from the Navigation Pane. Select General under Transactions.
4. Reopen the Support Debugging Tool window from the Windows Taskbar and click on Turn Off. The DexSQL log file now exists under the Data folder where Dynamics GP is installed.
That's it. That is the minimum amount of work
necessary to create a DexSQL log with the Support Debugging Tool.
As that is too easy, there are some additional options available on the main page to improve DexSQL logging.
To use the additional logging features:
1. Return to the Support Debugging Tool window.
2. Prior to starting a DexSQL log, two additional options can be selected in the SQL Logging area.
3. Select the Based on date and time radio button to add a date and time stamp to the DexSQL log filename. This allows for the creation of multiple logs over time.
4. Alternatively, select the Specified radio button to place the log file in a different location, and specify the filename:

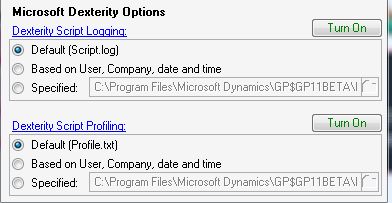
5. Below the SQL Logging option are two similar logging options—Dexterity Script Logging and Dexterity Script Profiling. Dexterity Script Logging logs Dexterity events. Dexterity Script Profiling tracks Dexterity calls and the time it takes them to complete. Both are useful but less commonly applied than SQL logging:

There's more...
On-demand logging just scratches the surface. The Support Debugging Tool can even log events automatically.
Automatic Logging
The Support Debugging Tool can log events automatically based on the type of event to be logged.
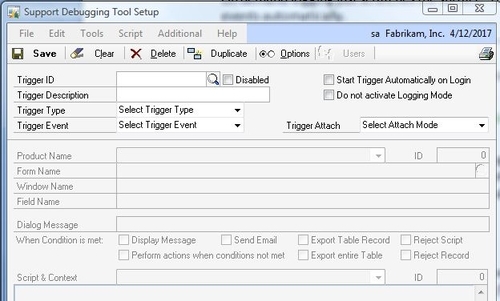
Automatic logging is set up under Options | Setup Automatic Debugger Mode on the Support Debugging Tool screen:

The number of options available for automatic logging
is too much to cover in this recipe but this process is great for
tracking down errors that are hard to reproduce. The Support Debugging
Tool manual has full coverage of this feature.