1. Introduction
Performance and monitoring is all about being
proactive, and providing a healthy (free from viruses, enough storage
space, proper server utilization, and so on), efficiently working
SharePoint 2010 site for users. Sites may function, but an administrator
must be cognizant enough to determine whether or not they are working
efficiently and whether they can be scaled. To answer these questions,
the administrator needs to be aware of the tools at his/her disposal.
SharePoint is a broad and deep application, having
hundreds of different technologies built into it. Add to this the
capability to integrate with existing technologies. The result of all
this is a complex application that can efficiently resolve user issues
but is challenging to monitor.
Let's take an example of the Content Query Web Part (CQWP)&;.
It is a great technology for exposing content on the home page from
other parts of the site. Often, important content is buried across sites
or deep within a site. Users have to navigate through too many clicks
to find the information.
The obvious place to put the CQWP is on the home
page. One day, the administrator gets reports from users of the page
hosting this web part having performance issues; users report page
timeouts to the administrator and they report strange information on the
page.
The administrator must go through a list of possible causes. The causes might include:
Is the problem how many sites CQWP traverses to display data?
Has the CQWP been customized to bring custom fields back?
Does the CQWP bring back only the fields that were specified?
Was a custom query written using CAML and put into the CQWP? If so, how efficient is that query?
Were there any overrides, and if yes, what were they and how can they affect performance?
How many CQWPs are being used on one page?
The point being made here is that this is an out of
the box web part and there is a lot that a user can do with it that can
affect page load time.
Server-side code introduces a different complexity,
such as the possibility of memory leaks. Memory leaks in a system are
like termites — you don't notice them at first, but when you do, your
system seems out of resources. Like termites, identifying and getting
rid of system leaks is a major pain point and cannot be easily done.
SharePoint has a best practice analyzer included with Central Administration, Monitoring and Reporting under the recipe named Editing rule definitions in health analyzer. This is powerful and extensible and provides critical information to the administrator on the health of the farm.
But just like the carpenter who could build a house
with just a hammer, there are other powerful tools that supplement the
health analyzer. These tools are found outside of SharePoint and help
the administrator to perform his/her duties more efficiently. The tools
will point to other possible issues such as memory leaks and page load
times that affect SharePoint. This gives you, as an administrator, a
broad picture of the possible issues.
Once these issues are identified, there should be
possible resolutions. One such tool featured in the recipes here does
just that. The tool is named Virtual Round Trip Analyzer. It provides
the suggested best practices.
These tools should be used carefully and in
conjunction with each other. Becoming knowledgeable on what is available
and how to utilize them will arm you with the information you need,
making you a smart SharePoint 2010 administrator.
2. Enabling HTTP Request Monitoring and Throttling
To understand resources and the SharePoint 2010
application, the analogy of a state government will be used. A state
government provides the foundation for a system of governance, checks
and balances, and branches to that government at a local and regional
level. The government and its branches provide infrastructure and
resources to the citizens.
Citizens are the users of this infrastructure.
Citizens create businesses and provide more resources, but at the same
time also use the resources provided by the government. With an
increased number of users and businesses, the stress on the government
and its infrastructure grows. The government must scale its resources
and performance to meet the needs of its users.
This is SharePoint 2010 — a super .NET application
that provides resources and an infrastructure to its users and
businesses. Resources are critical to the health and performance of this
ecosystem.
As an administrator, it is critical to understand the
resources consumed by SharePoint 2010. In SharePoint, it is possible to
manage these resources and put limits in place, so the servers remain
healthy and do not go down.
This recipe shows how to enable HTTP Request Monitoring and Throttling.
Getting ready
You must have farm-level administrative permissions to the Central Administration site.
This recipe uses PowerShell. You must be a member of the SharePoint_Shell_Access database role on the configuration database. You also must be a member of the WSS_ADMIN_WPG local group.
How to do it...
Open the Central Administration screen and click Application Management.
The first section is Web Applications. Under it, click Manage Web Applications.
Click to the right of the web application so that the line is selected.
On the ribbon, select General Settings and then Resource Throttling.
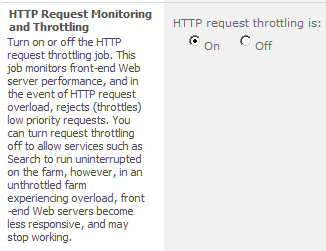
At the bottom of the ensuing pop-up screen, there is a section as shown in the following screenshot:

Select the On option.
On the publishing farm server, select click Start | All Programs | Microsoft SharePoint 2010 Products | SharePoint 2010 Management Shell.
In the PowerShell command prompt, type in the following commands:
$setting = (Get-SPWebApplication "http://server").HttpthrottleSettings
$settings
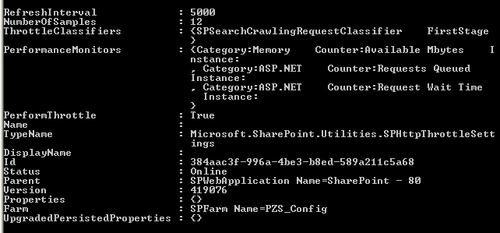
The output of the command is shown in the following screenshot:

How it works...
When Request Throttling is enabled, the state of each
web frontend server is evaluated at a request level. A request is the
information asked for on the web frontend by the user and then sent to
SQL Server.
Throttling is enabled at a web application level, as
shown in steps 1 to 6. Several metrics are sampled and a server health
score of 0 to 10 is assigned to the request. The higher the score, the
worse the state of the server.
Throttling is implemented when the score is 10. At
this point, any new web page will result in a 503 error. Administrators
know the 503 error page indicates that the servers have no more
resources to satisfy the request.
Steps 7 and 8 show how to access the SPHttpthrottleSettings object. This is where the settings for throttling are set.
The settings are as follows:
RefreshInterval&;: Amount of time between samples. The preceding screenshot shows the time set to five seconds (5000 miliseconds).
NumberOfSample&;: Samples of each
counter are collected for measurement. These are weighted and used in
an algorithm that cannot be modified. The default is twelve samples per
minute.
ThrottleClassifiers&;: Set of rules that classify requests.
PerformanceMonitors&;: Specifies the counters associated with HTTP Request Monitoring and Throttling.
PerformThrottle&;: This turns on or off request throttling for the web application specified. Display true for enabled.
There's more...
With PowerShell, you can see as well as set the performance counters that SharePoint is currently utilizing.
Use the following command to see the Throttling settings:
Get-SPWebApplicationHttpThrottlingMonitors http://yourserver
Use the following command to set the Throttling settings:
Set-SPWebApplicationHttpThrottlingMonitors-URL <http://yourserver>
More info
Thresholds cannot be configured through Central
Administration. They must be configured through PowerShell. In order to
read diagnostics, refer to the ULS Log and event logs located on the
server.