1. Creating Spirals
You can create two types of spirals: symmetrical and logarithmic (Figure 1). The space between revolutions of a symmetrical spiral is constant, while the spacing in a logarithmic spiral increases with each new revolution.

To create a spiral:
1. |
Select the Spiral Tool from the Object flyout in the toolbox or press . .
The pointer changes to a cross-hair with a tiny spiral attached to it.
|
2. |
Select a symmetrical or logarithmic spiral by clicking the appropriate button on the property bar (Figure 2).

|
3. |
Indicate the desired number of revolutions by entering a number in the Spiral Revolutions text box.
|
4. |
If you've chosen a logarithmic spiral, set a revolution expansion
factor by dragging the slider or by entering a number in the Spiral
Expansion Factor text box.
|
5. |
To create the spiral, left-click and drag diagonally. Release the mouse button when the spiral is the desired size.
|
Tips
Unlike drawing polygons and stars, you must specify spiral settings on the property bar before you draw. Settings changed afterward won't modify a selected spiral; they apply to the next spiral drawn.
The manner in which a spiral is displayed depends on the diagonal direction that you drag. Try all four possibilities.
To
set a different line width, type, color, or end effect (such as
arrows), select the previously drawn spiral, choose Edit >
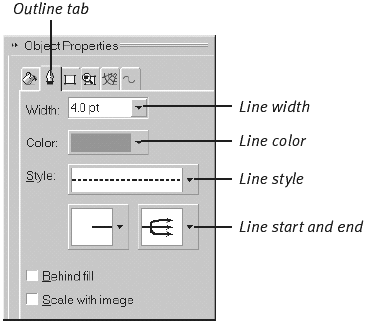
Properties, and click the Outline tab of the Object Properties docker (Figure 3).

2. Drawing Grids
If you want to create an object that looks
something like graph paper or a spreadsheet grid, you can use the new
Graph Paper Tool.
1. |
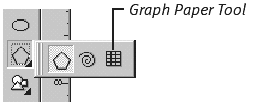
Select the Graph Paper tool from the Object toolbox flyout (Figure 4).

The pointer changes to a cross-hair with a tiny grid attached to it.
|
2. |
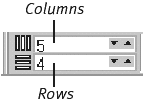
In the property bar text boxes, specify the number of columns and rows for the grid (Figure 5).

|
3. |
To draw the grid, click and drag.
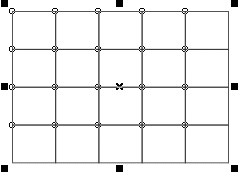
Release the mouse button when the grid is completed. The grid is selected (Figure 6).

|
Tips
To draw a grid with a square outline, press  as you drag.
A
grid is actually composed of a series of grouped rectangles. If you
want to modify any of the individual grid cells (to remove a cell or
selectively color it, for example), you must first ungroup the grid.
Select the grid, and then choose Arrange > Ungroup (or press ).
).
You must specify the number of grid rows and columns before drawing. Settings changed afterward won't modify a selected grid; they apply to the next grid drawn.