SharePoint 2010 runs on a server with Windows 2008.
This has a built-in tool called Performance Monitor. As a SharePoint
Administrator, you should be aware of this tool and its components.
Performance Monitor is a tool intended for use by IT
professionals or computer administrators. There are many components that
could limit the performance of your SharePoint system, including
Performance Monitor gives a graphical representation
of the measures that are chosen. This provides you with a quick way to
identify problems and the trends.
In this recipe, we will show how to use Performance Monitor and change a few of the available counters.&;
Getting ready
To create data collector sets, configure logs, or
view reports, the console must run as a member of the Administrators
group or the Performance Log Users group.
How to do it...
Select Start | Administrative Tools and then select Performance Monitor.
Select the computer from the drop-down list.
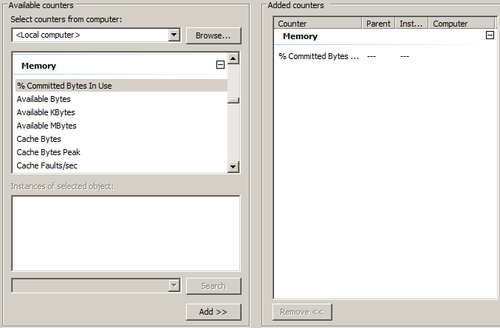
Click the green plus sign (shown in the screenshot), which is the icon for the Add Counters option.

The Add Counters dialog box opens. Navigate to Memory, click the plus sign, and select % Committed Bytes In Use. Click the Add button below the text boxes. Your screen should look like the following screenshot:

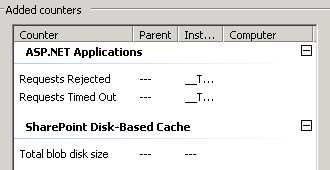
Follow the same process as step 3 for the following counters:
ASP.NET Application: Request Rejected, Requests Timed Out
SharePoint Disk-Based Cache: Total blob disk size
You should see a screen similar to the following screenshot:&;

How it works...
Performance Monitor shows specific performance
counters in a graphical view. It works in real time so that you can
monitor the health of your servers.
As can be seen when choosing a counter, there are
hundreds of counters. Each counter is assigned a different color and
with that you can delineate which line in the graph represents which
counter.
The counters can be selected not only one at a time, but also by group by holding down the Ctrl key.
The ribbon toolbar shown in the screenshot can be used for the following:
View Current Activity: Real-time view of counters.
View Log Data: Enables user to create a log file.
Change Graph Type: Three different types: Line, Histogram, or Report.
Add: Adds counters.
Delete: Removes counters.
Highlight: Click on a counter and
then click highlight. This highlights the counter. It is a useful
setting for focusing on a particular measure.
Copy Properties: Creates a copy of the current selected counter and its properties.
Paste Counter List: Imports counter settings from the clipboard. This is helpful when you have more than one server that is being monitored.
Properties: Shows a dialog that
enables the user to change the color of a line, scale, width, and style,
along with adding and removing of counters. In addition, things such as
the graph can be changed in a multitude of ways.
Freeze the display: Conversely, you can then update the display or enable it in real-time again.&;
There's more...
If you have to go and select counters each time you
need to run Performance Monitor, it is an indication of inefficient
functioning. For your server instance, through trial, you will find the
set of counters that give you the information you need.
Windows 2008 has the ability to create a Data Collector Set. This is a group of counters that you have defined and saved.
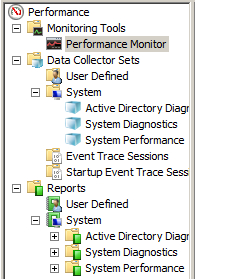
In Performance Monitor, on the left-hand side, there is a console tree that looks like the following screenshot:

Right-click on the User Defined option under Data Collector Sets. Click New and a wizard guides you to create a collection of counters.
Once the collection is created, the Data Collector Set will be shown under the User Defined option. By right-clicking on it, you can select the Start option and begin the monitoring task.
More info
Microsoft has created many performance counters. As
you navigate through the list, you will see the counters related to
SharePoint, FAST (if installed), and WSS.
If the organization has the enterprise version of SharePoint, there are counters for the following services:
These services are cache based due to their nature.
If you are running any of these, monitoring them for performance tuning
is advisable.