Exchange 2013 is the first version of
Exchange to be written since the Exchange product group became
responsible for Exchange Online within the Office 365 platform. This is
not often discussed outside of Microsoft. However, there is no denying
that having Exchange developers and program managers called out to
resolve faults within Office 365 has dramatically affected the
direction that Exchange 2013 has developed. The benefits of running
Office 365 are obvious when you look at a few new features in Exchange
2013.
Managed Availability
Managed Availability (MA) is a
total shift in approach for Exchange. At its core, MA is a native
health monitoring and recovery system. Historically, Exchange has
provided a number of performance counters and application events that
described how the system was performing. It was then the job of some
other program or utility to analyze that information and do something
with it. In Exchange 2013, this has been taken to a whole new level.
Exchange MA is not only aware of how the system is behaving from both a
performance and health perspective, but it also has predefined recovery
actions that it can trigger to attempt to resolve any issues itself.
Exchange is now aware of itself in three ways:
- Availability
- Latency
- Errors
These items together define the health of the Exchange Server.
The MA service is made up of three main processes:
- Probe engine
- Monitor
- Responder engine
The probe engine is responsible for
gathering data about the running of Exchange Server. This data is then
passed to the monitor, which applies a set of logic to determine system
health. If the system is found to be unhealthy, the responder engine
will use its own logic to determine the correct recovery action to take
at the time of the event.
Like most things, the monitors can be
queried via PowerShell and have the following values: Healthy or
Unhealthy (Degraded, Disabled, Unavailable, or Repairing). Once a
monitor has entered an unhealthy state, a responder will take recovery
action. This action will depend on the event and also on how many
previous times it attempted to recover from it. The recovery action may
be as simple as terminating and restarting a service, or it may be as
significant as forcibly terminating a server.
When this feature was first presented to
the messaging community, many people commented that there would be no
need for Exchange operations teams or third-party monitoring solutions.
This was nonsense, obviously, but Managed
Availability is likely to reduce the frequency of someone being
summoned to deal with an easily rectifiable problem. If Exchange
experiences a failure that MA cannot resolve, then in all likelihood
the resolution process will require a skilled third-party support
resource.
VIEWING SERVER HEALTH
Managed Availability brings with it a record of
server health. To view the health information for a single server, run
the following PowerShell command, replacing the server name with that
of your own server.

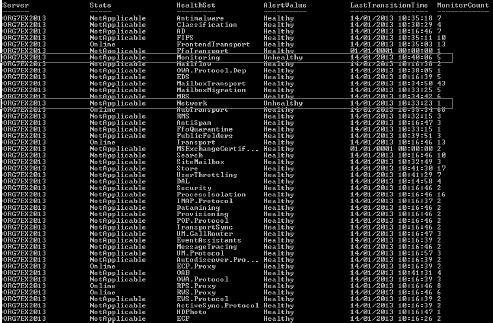
Figure 1 shows an example from one of our lab machines. Some unhealthy monitors are highlighted.
FIGURE 1 Sample health report output

We can tweak this command a bit to show the unhealthy monitors:

Figure 2
shows the output of this command, listing the unhealthy monitors for
this server. In this example, you can see that we have a problem with
the Monitoring and Network health-sets, but it doesn't give us any more
information.
FIGURE 2 Unhealthy monitor example

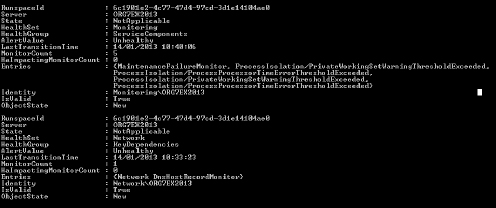
To get more information, you need to pipe the previous command to format-list (fl).

Figure 3
shows the detailed output of our failed health monitors. You can see
from this that we have a number of problems with system resources:
FIGURE 3 Monitor detail example

MonitorCount            :5
Entries:
{MaintenanceFailureMonitor, ProcessIsolation/PrivateWorkingSetWarningThresholdExceeded,
ProcessIsolation/ProcessProcessorTimeErrorThresholdExceeded,
ProcessIsolation/PrivateWorkingSetWarningThresholdExceeded,
ProcessIsolation/ProcessProcessorTimeErrorThresholdExceeded}
Remember that this is a lab system, and so
it has less than the minimum recommended system resources available.
Thus, it would be a surprise if Managed Availability reported it as
healthy. The report also shows us that this particular monitor has been
triggered five times previously.
The second event is from the Network
healthset, and its entries suggest that we have a problem with this
server's DNS host record. The MonitorCount of 1 suggests that this is
the first time that this problem has occurred:
MonitorCount            : 1
Entries:
{Network DnsHostRecordMonitor}
Hopefully, this brief walkthrough has
highlighted the monitoring enhancement possibilities of Exchange Server
2013. For some environments, it may be possible to use Managed
Availability and PowerShell to create an adequate monitoring and
alerting system. Obviously, this is not to say that you will never need
an additional solution for Exchange 2013. Nevertheless, many
organizations will be able to operate without one for Exchange 2013.
Workload Management
Workload Management (WLM) is another new process
within Exchange 2013 that aims to reduce the workload on the operations
staff. The primary goal of WLM is to prioritize user experience over
system tasks. WLM is also responsible for stopping a single “bad”
client from overconsuming system resources.
Before we discuss what WLM does, we need
to address what system resources actually are and how we think about
them. System resources represent things like processor capacity,
physical memory, or storage IOPS. Historically, these tended to be
reported by percentage utilized; that is, how much of your system is
actively at work at a given time. The tendency here is for teams
to view low percentage utilized as good and high percentage utilized as
bad. This behavior is understandable to some degree, since having a low
percentage utilization of core system resources is likely to mean that
your end users are experiencing good performance.
In recent years, however, there has been
an increasing focus on service running costs. Thus, having systems
running in the single-digit percentage utilization range represents a
large amount of wasted resources. Ideally, you want to make full use of
your system resources without impacting end-user performance. This is
partly what WLM tries to do.
WHAT IS WORKLOAD MANAGEMENT?
Workload Management (WLM) means trying to
optimize resource utilization while at the same time preserving the
end-user experience. It does this via the following processes:
- Intelligent prioritization of work
- Resource monitoring
- Traffic shaping
WLM is aware of how Exchange Server is
managing its end-user requests by monitoring performance counters. It
is then able to schedule background system tasks to use the space
resources available. If these system tasks begin to impact end-user
performance, then they are throttled back until they do not, or it may
potentially delay these tasks from running until the system has more
resources available. This is a simple but very ingenious way of
removing the requirement to plan and schedule things like maintenance
tasks. An important point to remember here is that background database
maintenance, a process that performs physical database integrity
checking, is never throttled, regardless of system resource usage.
The impact of WLM on operations is
interesting. For example, consider moving mailboxes. A mailbox move is
subject to system WLM, and so it will be throttled back if it impacts
end-user experience. This means that you could perform mailbox moves
during the day knowing that WLM would protect service performance. The
mailbox moves may take a little longer than if you performed them
during off hours, but since they can happen online, end users may not
even notice.
Also, think about our trending and
resource planning. If WLM is making use of system resources for
background tasks, then this will impact how your system resource
trending patterns will look; that is, they may appear as more highly
utilized than with Exchange 2010 across the workday. However, the huge
spikes in nightly maintenance tasks will not be apparent. The concept
of trending system resources is still vital for Exchange 2013. Jeff
Mealiffe, the program manager responsible for Exchange performance and
sizing, often refers to this as “smoothing peaks and filling in the
valleys.” The workload remains the same, however, because WLM is just
spreading it out more evenly.
WLM also introduces an improved end-user
throttling system to prevent monopolization of system resources. The
idea behind this is to promote fair use of Exchange Server resources
for all users. Exchange Server 2010 introduced user throttling, and
Exchange Server 2013 takes this further by providing better resource
utilization tracking, using shorter client back-off delays, and the
introduction of a token bucket.
From a deployment perspective, it is worth
noting that if you are deploying in coexistence with Exchange Server
2010, mailboxes hosted on 2010 servers will use the 2010 policies,
while mailboxes migrated to Exchange 2013 will make use of the newer
policies.
Our
recommendation for throttling policies remains the same in Exchange
2013 as it did in Exchange 2010: Leave the default global policy at its
default values, and create and apply a new policy for system mailboxes
where required.