In this section, you'll learn about creating custom views. You also learned that a view is composed of specific parts
such as tables, filters, groups, highlights, and formatted text and
bars. In creating custom views,
you can set up all these components in the manner that best suits your
needs for planning, tracking, and communicating.
1. Key Elements of a View
Project comes with
predefined views that may be sufficient for your needs. However, setting
up custom views often makes for more effective use of the tool. Before
you learn about customizing new views, it's important to understand the
primary elements that make up a view.
Figure 1
shows the core components of a view. This example is the view
definition for the default Gantt Chart view. To access the View
Definition dialog box, follow these steps:
In the Gantt Chart view, go to View tab => Task Views group. Note: For resource views, go to the Resource Views group.
From the drop-down list beside any of the View buttons, select More Views.
In the Views list; highlight the View you want to edit.
Review
the core components in the View Definition dialog box. To exit the
dialog box without making changes, click Cancel, and click Cancel again.
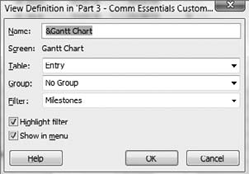
In addition to letting you give a
view a name and select what type of view it is, such as Gantt,
calendar, or network, the main choices in the View Definition dialog box
include the following:
Table selection (built-in or custom)
Groups (built-in or custom)
Filters (built-in or custom)
Show highlights (for filters)
If you plan to create a
custom view based on custom tables, filters, or groups, you need to
create them first so they're available to be added in the View
Definition dialog box. Custom fields can be added to any custom or
built-in table, so you need to create them first if you plan to use them
in custom tables that may be part of a custom view.
2. Creating a Custom View
In this section, we'll look at creating a custom view based on using custom parts such as tables and filters.
2.1. Custom View Example: Stakeholder Task View
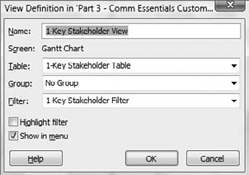
To create a custom task view (see Figure 2), follow these steps:
Select View tab => Task Views group => Gantt Chart drop-down list (or the drop-down list from any other task view button) => More Views.
Click New, and select Single View.
In the View Definition dialog box, in the Name field, enter the name of the new view. In this example, enter 1-Key Stakeholder View.
Beside Screen, select Gantt chart (it should be the default).
From
the Table drop-down list, select 1-Key Stakeholder Table or another
table. Note: This is a custom table that you must create before it will
appear in this list.
From the Group drop-down list, select No Group. You aren't using a group for this view.
From
the Filter drop-down list, select 1-Key Stakeholder Filter or another
filter. Note: This is a custom filter that you must create before it
will appear in this list.
Don't select the Highlight Filter check box.
Select Show in Menu to make the custom view appear in the drop-down list under Custom.
Click OK, and then click Apply.
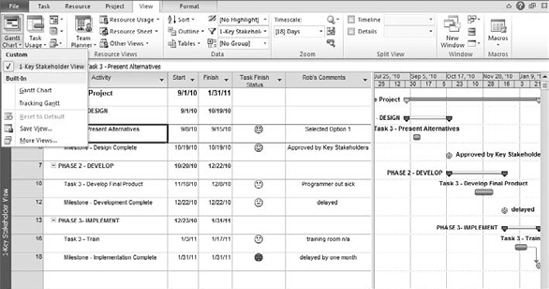
After you apply the view, the custom table and the custom filter run at the same time, as shown in Figure 3.
To return to the default Gantt Chart view, click the Gantt Chart button
on the View tab.
As you can see in the Gantt Chart drop-down list in Figure 3,
custom views are separated from built-in views, and the newly created
1-Key Stakeholder View is in the Custom section. You can switch from the
Gantt Chart view to this new view by selecting it from the list. The
primary benefit of this approach is that every time you need to generate
communication to that stakeholder group, you don't have to remember to
change the table, apply the filter, modify the text and bar styles, and
so on. The view is ready to go at the touch of a button.
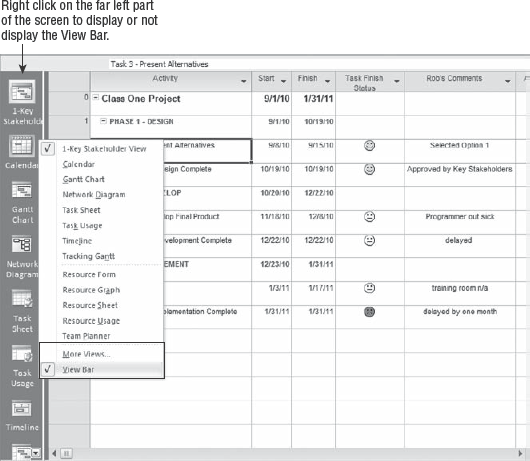
You can also display the View
bar on the left side of the screen for easy access. In previous versions
of Project, this was a plus, because views were often hidden under a
File menu selection. However, the ribbon makes it easy to access various
task and resource views. Also, in the status bar at lower-right, you
can easily switch from one view to another, although the selection is
limited. To display the View bar display on your screen as shown in Figure 4, follow these steps:
Right-click the view name at far left on the screen.
From the list that appears, select View Bar.
|
Over the years, I've
worked with hundreds of organizations to set up and implement custom
project-management solutions. I always start by trying to match their
project-management methodologies and processes to the tools. In doing
so, I've found that in most cases, you can focus on three custom views
to help support better project management using Project.
One custom view should be
tailored to the planning process. You can create a custom table with
custom fields to support the way an organization plans projects. For
example, if work is important, you can add a Work column to plan person
hours. If it's important to flag specific tasks for reporting, then you
add a custom Flag field. You then create a custom view called the
Planning View, with the custom table and any associated custom formats
for the text and bar styles.
Another custom view that is
often needed supports the monitoring and controlling processes that
cover updating and tracking. Based on the needs of the organization, you
create custom fields (such as red, yellow, and green light indicators
for status), add them to a custom table, and create a custom view for
tracking. This also includes formatting to display baseline and other
important information, such as variance.
Finally, create at least
one custom view to enhance communication. For example, you may have a
standard project-review meeting or committee that you communicate with
regularly. Perhaps a filtered view on key tasks or milestones, complete
with graphical indicators and status comments, is in order.
|
If you select Show in Menu
when you create a custom view, the view is added to the View bar. The
View bar makes it easier to switch from one view to another, but it
takes up valuable screen real estate; the ribbon's organization already
makes it simple to switch views.
As you think about how to be
more effective with Project when you plan, track, and communicate,
consider the types of custom views and custom components that make the
most sense for your situation. These can be included in a template so
that when you start a new project, you automatically inherit these
views.