IT tutorials
 
Office
 

Microsoft Project 2010 : Viewing Baselines (part 2) - Formatting the Gantt Chart to Display the Baseline

- Free product key for windows 10
- Free Product Key for Microsoft office 365
- Product Key Free : Microsoft Office 2019 – Serial Number
3/30/2014 2:12:13 AM

2. Formatting the Gantt Chart to Display the Baseline

Although the default Gantt Chart view doesn't 
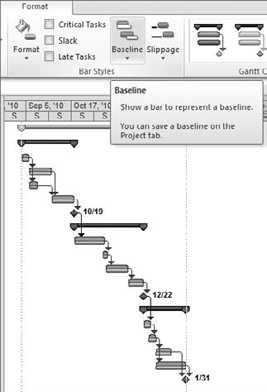
display the baseline, you can reformat the view to display the baseline at any time. One quick way to do this uses the Format tab; follow these steps (see Figure 3):

  1. In the Gantt Chart view, go to Format tab => Bar Styles group.

  2. Click the Baseline drop-down list, and select Baseline (the first option in the list).

Custom Tracking View

Over the years, I've worked with many clients to customize solutions using Microsoft Project. One of the key components to a successful implementation is to customize the tool to support the client's project-management processes, which include not only planning but also tracking and updating.

The solution typically includes developing a custom view for tracking and updating to support the project's monitoring and control stage. This includes adding custom fields such as the Task Finish Status indicator and the Needs Updating indicator.

The custom view also includes a custom tracking table that's based on the Variance table but modified to include % Complete and the two custom fields just described. The custom view also includes custom bar formatting to display the baseline in the Gantt bar area as well as custom gridlines to display both the current date in red and the project start date in blue.


This is similar to the Tracking Gantt view, except that you don't have to switch views to display the baseline. The baseline bars are the bottom bars, which are grey; they will stay in place as the current plan is adjusted. Having the baseline bars displayed in the Gantt chart makes it more effective for visually tracking and identifying variances.

You can add any of the baseline fields to any table at any time.

Figure 3. Formatting the Gantt chart to display the baseline
 
Others
 
- Microsoft Project 2010 : Viewing Baselines (part 1) - Tracking Gantt View and the Variance Table
- Microsoft Project 2010 : Understanding and Setting Baselines
- Microsoft Project 2010 : Strategic Importance of Project 2010
- Microsoft PowerPoint 2010 : Animating a SmartArt Graphic (part 2) - Apply a Customized Animation to a SmartArt Graphic, Reverse the Order of a SmartArt Graphic Animation
- Microsoft PowerPoint 2010 : Animating a SmartArt Graphic (part 1) - Animate a SmartArt Graphic
- Microsoft PowerPoint 2010 : Coordinating Multiple Animations (part 2) - Set Time Between Animations,Modify an Animation
- Microsoft PowerPoint 2010 : Coordinating Multiple Animations (part 1) - Work with Multiple Animations, Modify the Animation Order
- Microsoft OneNote 2010 : Collecting and Researching Information - Inserting Documents and Files (part 3) - Inserting a Scanner Printout on a Page
- Microsoft OneNote 2010 : Collecting and Researching Information - Inserting Documents and Files (part 2) - Inserting a File Printout on a Page
- Microsoft OneNote 2010 : Collecting and Researching Information - Inserting Documents and Files (part 1) - Inserting a Copy of a File on a Page
 
 
Top 10
 
- Microsoft Visio 2013 : Adding Structure to Your Diagrams - Finding containers and lists in Visio (part 2) - Wireframes,Legends
- Microsoft Visio 2013 : Adding Structure to Your Diagrams - Finding containers and lists in Visio (part 1) - Swimlanes
- Microsoft Visio 2013 : Adding Structure to Your Diagrams - Formatting and sizing lists
- Microsoft Visio 2013 : Adding Structure to Your Diagrams - Adding shapes to lists
- Microsoft Visio 2013 : Adding Structure to Your Diagrams - Sizing containers
- Microsoft Access 2010 : Control Properties and Why to Use Them (part 3) - The Other Properties of a Control
- Microsoft Access 2010 : Control Properties and Why to Use Them (part 2) - The Data Properties of a Control
- Microsoft Access 2010 : Control Properties and Why to Use Them (part 1) - The Format Properties of a Control
- Microsoft Access 2010 : Form Properties and Why Should You Use Them - Working with the Properties Window
- Microsoft Visio 2013 : Using the Organization Chart Wizard with new data
Technology FAQ
- Is possible to just to use a wireless router to extend wireless access to wireless access points?
- Ruby - Insert Struct to MySql
- how to find my Symantec pcAnywhere serial number
- About direct X / Open GL issue
- How to determine eclipse version?
- What SAN cert Exchange 2010 for UM, OA?
- How do I populate a SQL Express table from Excel file?
- code for express check out with Paypal.
- Problem with Templated User Control
- ShellExecute SW_HIDE
programming4us programming4us