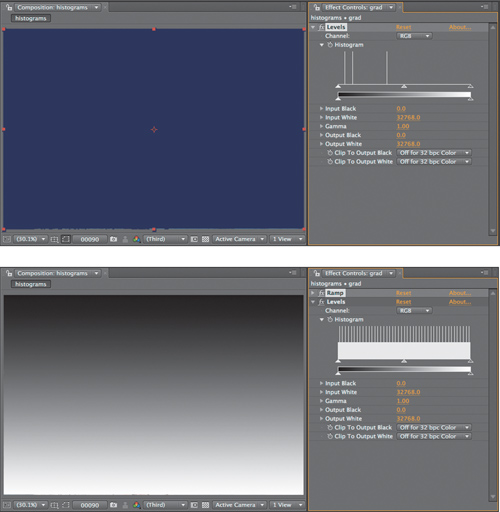
You might have noticed the odd appearance of the
histogram for an unadjusted gradient. If you were to try this setup on
your own, depending on the size of the layer to which you applied Ramp,
you might see a histogram that is flat along the top with spikes
protruding at regular intervals (Figure 1).

The histogram is exactly 256
pixels wide; you can think of it as a bar chart made up of 256 bars,
each one pixel in width and corresponding to one of the 256 possible
levels of luminance in an 8-bpc image. These levels are displayed below
the histogram, above the Output controls. In the case of a pure
gradient, the histogram is flat because of the even distribution of
luminance from black to white. If the image height in pixels is not an
exact multiple of 256, certain pixels double up and spike.
In any case, it’s more useful to look at real-world examples, because the histogram is useful for mapping image data that
isn’t plainly evident on its own. The point is to help you assess
whether any color changes are liable to improve or harm the image.
Despite that fact, you can try
a simple rule of thumb for a basic contrast adjustment. Find the top
and bottom end of the RGB histogram—the highest and lowest points where
there is any data whatsoever—and bracket them with the Input Black and
Input White carets. To “bracket” them means to adjust these controls
inward so each sits just outside its corresponding end of the histogram.
The result stretches values closer to the top or bottom of the dynamic
range, as you can easily see by applying a second Levels effect and
studying its histogram.
Tip
Auto
Levels serves up a result similar to bracketing Input White and Input
Black to the edges of the histogram. If that by itself isn’t enough to
convince you to avoid using Auto Levels, or really any “Auto”
correction, consider also that they are processor intensive (slow) and
resample on every frame. The result is not consistent from frame to
frame, like with auto-exposure on a video camera—reality television
amateurism. |
Try applying Levels to any image
or footage from the disc and see for yourself how this works in
practice. First densify the blacks (by moving Input Black well above the
lowest black level in the histogram) and then pop the whites (moving
Input White below the highest white value). Don’t go too far, or
subsequent adjustments will not bring back that detail—unless you work
in 32-bpc HDR mode . Occasionally a stylized look calls for crushed contrast, but generally speaking, this is bad form.
Tip
Footage is
by its very nature dynamic, so it is essential to leave headroom for the
whites and foot room for the blacks until you start working in 32 bits
per channel. You can add contrast, but once the image blows out, that
detail is gone. |
Black and white are not at
all equivalent in terms of how your eye sees them. Blown-out whites are
ugly and can be a dead giveaway of an overexposed digital scene, but
your eye is much more sensitive to subtle gradations of low black
levels. These low, rich blacks account for much of what makes film look
like film, and they can contain a surprising amount of detail, none of
which, unfortunately, shows up on the printed page. Look for it in the
images themselves.
Notes
LCD
displays, as a whole, lack the black detail that can be captured on
film. The next time you see a movie in a cinema, notice how much detail
you can see in the shadows and compare. |
The occasions on which you
would optimize an image by raising Output Black or lowering Output White
controls are rare, as this lowers dynamic range and the overall
contrast.
Problem Solving Using the Histogram
You
may have noticed that the Levels histogram does not update as you make
adjustments. After Effects lacks a panel equivalent to Photoshop’s
Histogram palette, but you can, of course, apply a Levels effect just to
view the histogram (as in Figure 1).
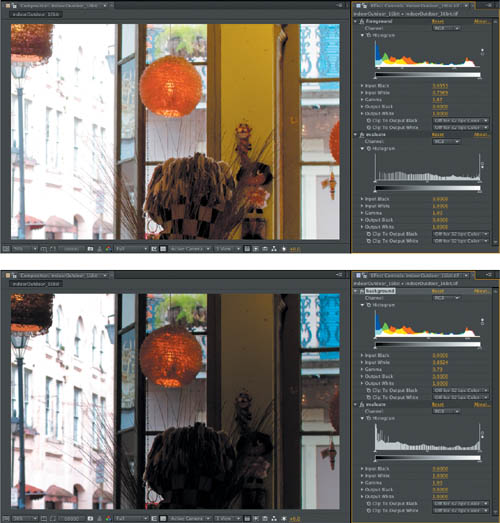
Spikes at the end of the second histogram (which is there just to
evaluate the adjustment of the first) indicate clipping at the ends of
the spectrum, which seems necessary for the associated result. Clipping,
then, is part of life.

Note also the gaps that
appear in the second histogram. Again, the net effect is a loss of
detail, although in this case, the gaps are not a worry because they
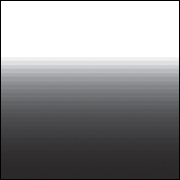
occur among a healthy amount of surrounding data. In more extreme cases, in which there is no data in between the spikes whatsoever, you may see a prime symptom of overadjustment, banding (Figure 3).

Banding is typically the
result of limitations of 8-bpc color. 16-bpc color mode was added to
After Effects 5.0 specifically to address this problem. You can switch
to 16 bpc by Alt-clicking (Opt-clicking) on the bit-depth identifier along the bottom of the Project panel (Figure 4) or by changing it in File > Project Settings.
